- Digital Beans
- Posts
- Digital Beans - Is this the best time to buy Crypto or assets in general
Digital Beans - Is this the best time to buy Crypto or assets in general
Digital Beans - Is this the best time to buy Crypto or assets in general
Shivam Sharma
March 01, 2025

Before we get into this, two quick requests I would want to make:
If you like the my content, do Reply to this email with a “Hi” This helps my content land direct to your inbox and not to promotions
Do share my newsletter with folks you think can benefit from this effort. Here’s the link https://thedigitalasset.beehiiv.com/subscribe
Hey there everyone! 👋 This is Shivam. I bring to you the 58th weekly edition of Digital Beans.
This is an effort through which I try to share my thoughts on the Digital Assets Industry and Business Models in the space. Your 0 to 1 guide for Digital Assets Industry
Read time - 5 mins
In this edition, the article I explore is titled "Is this the best time to buy Crypto or assets in general" Hope you enjoy it.
Spill the beans (What’s on my mind)
Key charts and takeaways for me
Whenever in doubt zoom out and that is exactly what we will do today to understand the broad sell off in the markets. The fear is at ATHs but that means it’s a great opportunity for us to scoooooop assets with fundamentals. I will use a combination of selected charts to show what I think may be the direction heading into short to medium term
Hey, let’s break down what’s going on with Bitcoin right now, using these charts to frame why it might be a sweet spot to buy assets given the macro conditions. The first chart shows the Bitcoin MVRV Ratio Z-score, which sounds fancy but is basically a way to measure if Bitcoin is overvalued or undervalued compared to how much people have paid for it (Market Value to Realized Value).
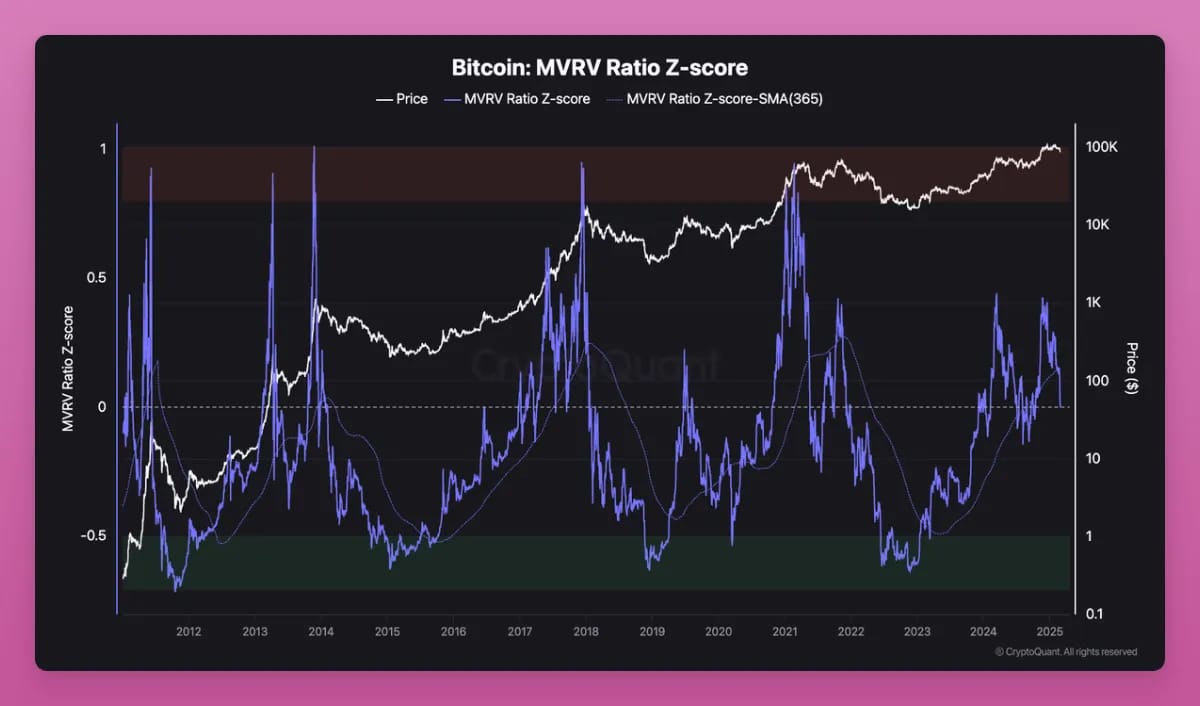
The blue line spikes up when Bitcoin’s price gets crazy high—like in 2017, 2021, and early 2024—showing it’s overbought and due for a pullback. But right now, in early 2025, that Z-score is dipping low, around -0.5 or below, which means Bitcoin is undervalued and oversold. It’s like finding a killer deal on a used car—beaten down in price, but still packed with potential.
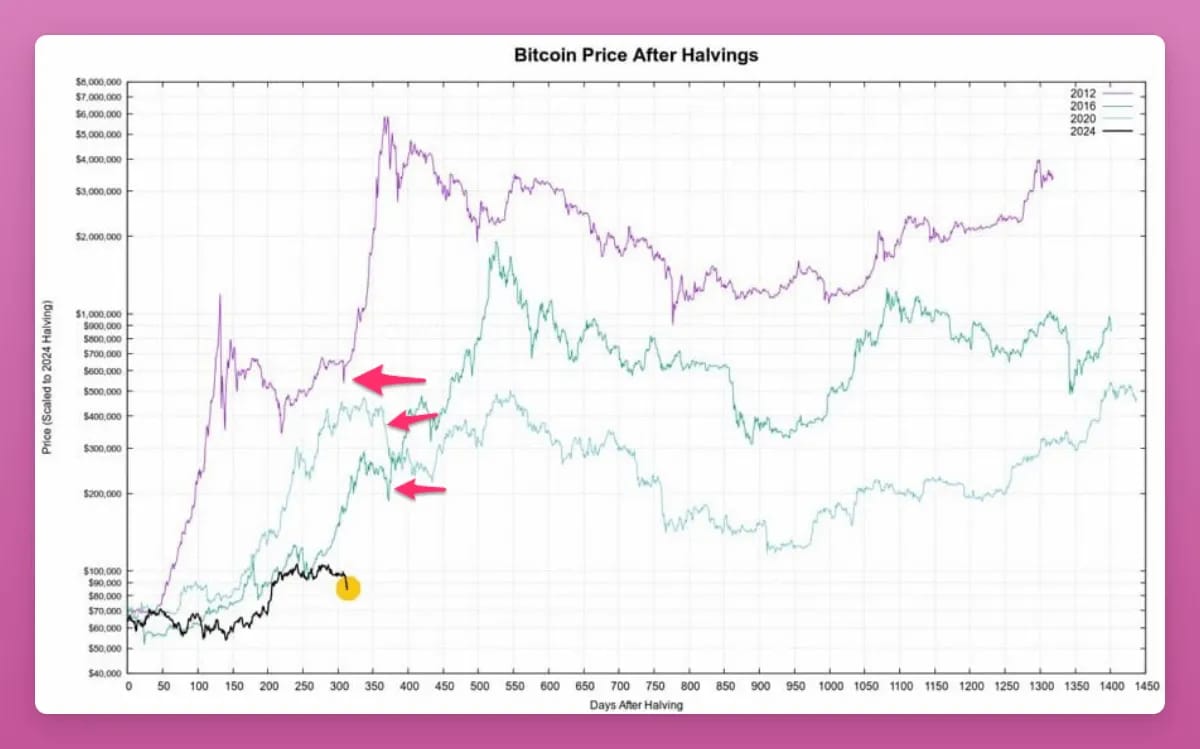
The second chart zooms out to Bitcoin’s price cycles after its “halvings” (when the reward for mining Bitcoin gets cut in half, happening roughly every four years in 2012, 2016, 2020, and 2024). Those red arrows mark where prices often dip hard after a halving, as seen in 2024, but history shows Bitcoin tends to bounce back big time—sometimes taking 12–18 months to hit new highs.
The next chart compares Global M2 (a measure of money supply, in billions of dollars, black line) with a 10-week lead and Bitcoin’s price (red line, right-hand scale) from 2023 to early 2025. Both lines show significant ups and downs, reflecting volatility in money supply and Bitcoin’s market value over time

Context: Global M2 represents the total supply of money in an economy, including cash, checking deposits, and other liquid assets. It’s often used as an indicator of liquidity and economic activity. The 10-week lead suggests that changes in Global M2 may predict Bitcoin’s price movements. The narrative mentions that this relationship has “largely played out now,” implying the current market dynamics align with the chart’s trends, and patience is advised amid ongoing volatility, which is described as the “price you pay for the returns” in crypto investing. A Flash Update video is promised for more details
Key Takeaway: The volatility in Bitcoin’s price is closely tied to fluctuations in Global M2, with recent trends suggesting the relationship has stabilized. Despite market ups and downs, patience is key, as volatility is an inherent part of achieving potential returns in crypto.
The final chart shows the relationship between Bitcoin's 3-month moving average (black line) and the GMI Financial Conditions Index (red line) from 2024 to early 2025. Both lines fluctuate significantly, indicating market volatility.
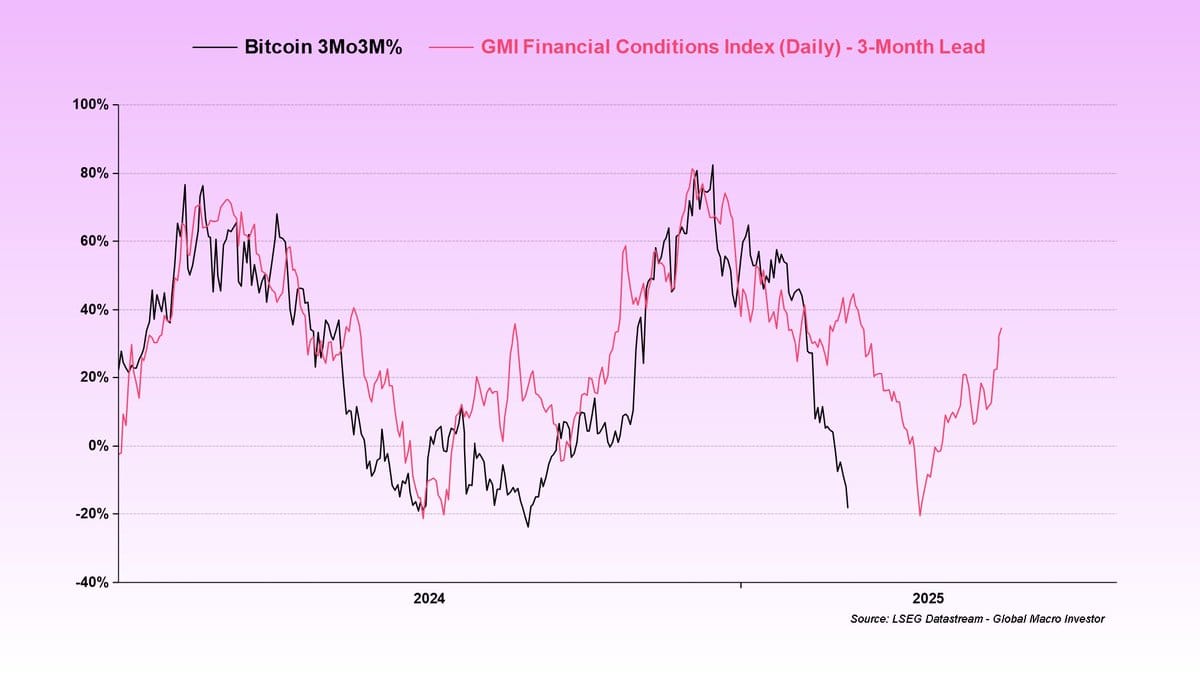
Context: The index provides a composite score that reflects whether financial conditions are tight (restrictive) or loose (accommodative), serving as a leading indicator for economic activity and asset prices
Key Takeaway: The current market turbulence, especially in crypto, stems from tighter financial conditions in Q4 2024, leading to reduced liquidity and economic slowdown fears. However, financial conditions have been easing recently, suggesting a potential recovery soon. Bitcoin, now at an oversold level, may see a rebound as sentiment shifts from bearish to bullish
The idea is just to reiterate for everyone that volatility is the price of the crypto game, but these charts suggest now’s a chance to grab Bitcoin and other assets cheap before the everything goes higher and higher
Till then, hold on to your dear assets
State of Crypto affairs - A quick look at the market
The global cryptocurrency market cap today: $2.9 Trillion
Daily change: 5.8% | YoY change: 20.1%
Bitcoin (BTC) is the largest cryptocurrency with a market cap of $1.7 Trillion
Bitcoin price today: $85,400
Weekly change: 11.4% | YoY change: 38.6%
Another important metric is Bitcoin dominance which can be used as a rough indicator of the relative strength of Bitcoin versus other cryptocurrencies.
Historically, Bitcoin leads the rest of the crypto market off the cycle lows and into the next bull market. BTC dominance increases early in cycles and decreases later as the wealth effect sets in and long-term holders rotate into altcoins for more upside.
Bitcoin dominance: Current Year: 57.0% | Last year (Mar 2024): 52.7%
Greed and fear index
The market went down last week and extreme fear levels are running the sentiment as the global economy is unsure of what is going to happen next
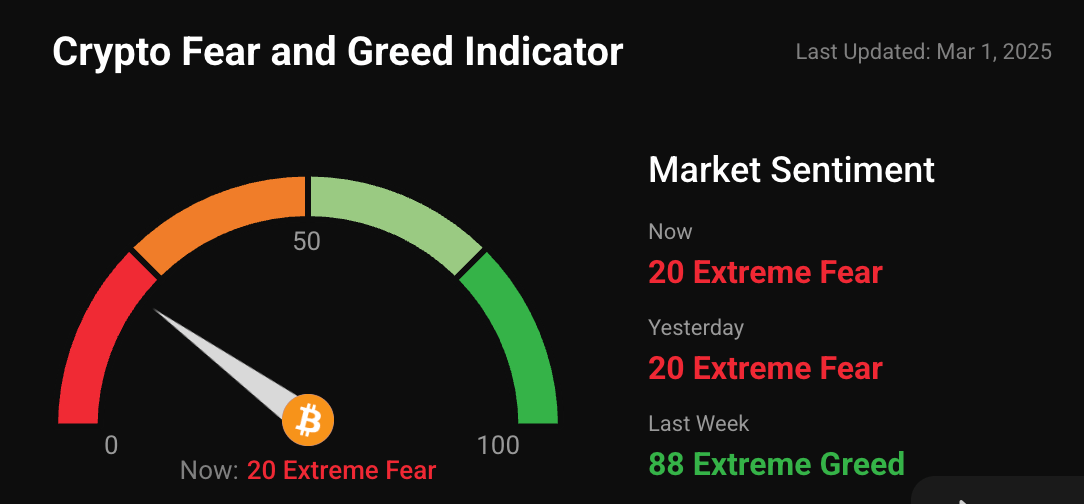
Note: The data used is based on metrics like Volatility, Surveys, Bitcoin Dominance, Social and Google Trends. Source: Coinstats
ETH as an ultrasound money narrative!
Let's have a look at Ethereum supply changes post its merge to a PoS blockchain from PoW.
The significance of the chart - understand how the supply of Ethereum is decreasing post the merge, which means “deflationary economics” for the Blockchain. In long term gives a sense of where the supply is headed
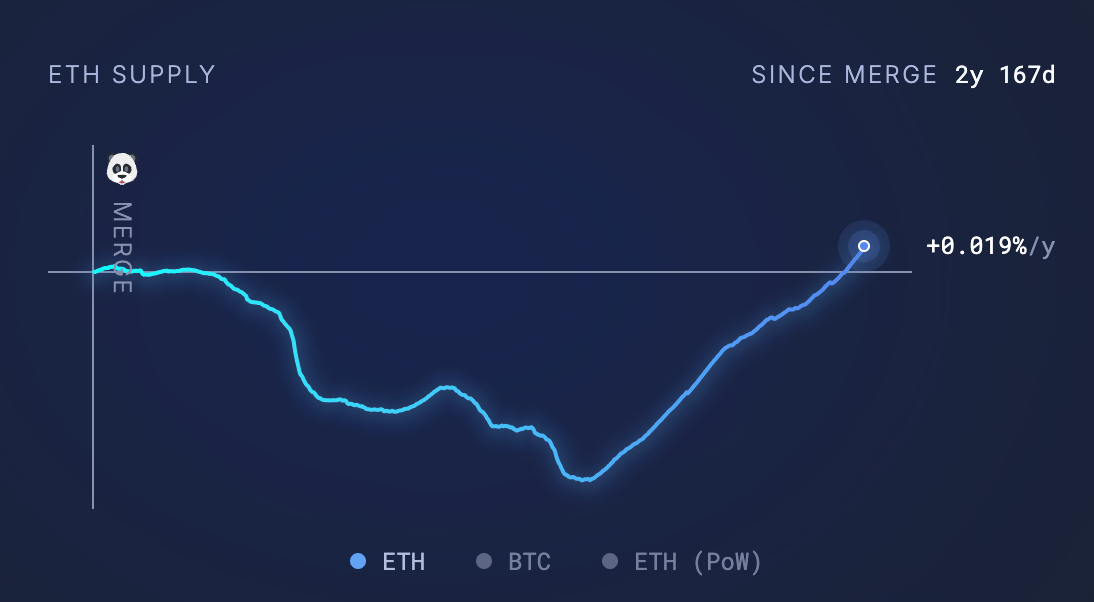
Supply change since merge POS +56,905 ETH
The graph highlights POS issuance since the merge. Not so impressive numbers, look bearish for ETH in the medium term given the supply of ETH is growing as there is lack of usage
What's brewing today? Bringing fresh beans to you
Coinbase Case Dropped by U.S. SEC as Agency Reverses Crypto Stance A landmark legal battle for the U.S. crypto sector, the government accusation that Coinbase ran an unregistered exchange, has been entirely abandoned
Virtuals Protocol revenue down 97% as AI agent demand fades AI agents platform Virtuals Protocol has seen its popularity dwindle and its performance stats decline across the board
What’s my tweet of the week?
There is silver lining
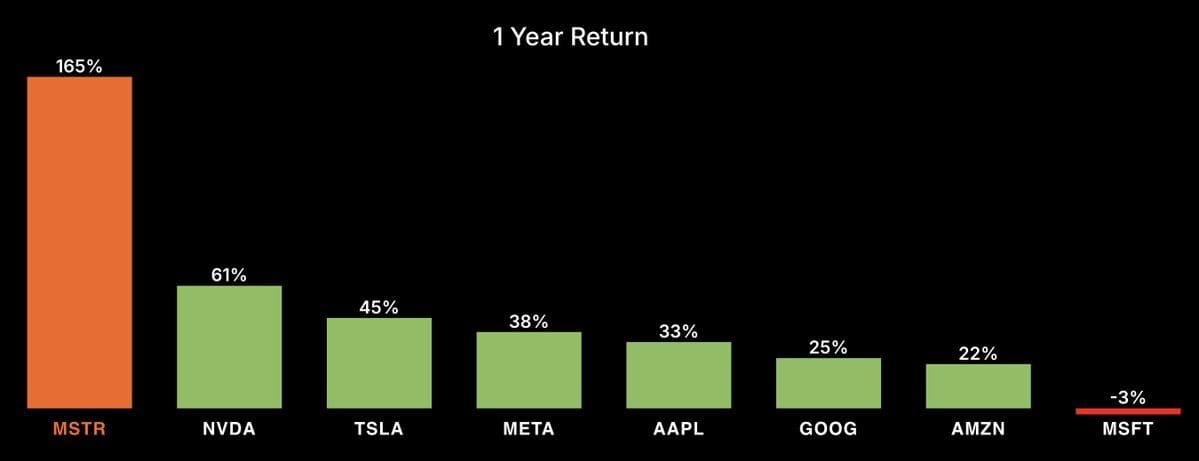
You need a @Strategy to beat the Magnificent 7.
— Michael Saylor⚡️ (@saylor)
9:44 PM • Feb 28, 2025
What did you think of today's edition?
DISCLAIMER: None of this is financial advice. This newsletter is strictly educational and is not investment advice or a solicitation to buy or sell any assets or to make any financial decisions. Please be careful and do your own research