- Digital Beans
- Posts
- Crypto Beans - Feb 12, 2023
Crypto Beans - Feb 12, 2023
Your 0-1 weekly crypto newsletter

Read time - 5 mins
Hey there everyone! 👋 This is Shivam
I bring to you the 7th weekly edition of Crypto Beans for the year 2023. We are into the second month into the year and I have received amazing feedback on the newsletter🚀, I feel super stoked for what lies ahead.
In this edition, apart from market update and important metrics, I also talk about "Fundamental Analysis of Crypto"
Loading.....

What is in it for you?
For all my friends who are getting this for the first time, this is an effort through which I try to share my thoughts on the crypto space and help you stay updated on the basics of the industry.
This is your 0 to 1 guide in crypto if you are looking to learn more about crypto and what it stands for. Okay done selling it 😛
Let's take off on this journey together 🚀 🚀
State of Crypto affairs? A quick look at the market
The global crypto market currently stands at $1.06 Trillion. It is still ~60% down(👎) from its all time high of $3 Trillion which it hit in November 2021.
The market came down after setting new year highs somewhat because of SEC crackdown on Kraken exchange and Gary Gensler calling ETH a security
The global cryptocurrency market cap today: $1.06 Trillion
Weekly change: -5.37% | Yearly change: -46.32%
Bitcoin (BTC) is the largest cryptocurrency with a market cap of $420 Billion.
Bitcoin price today: $21,790
Weekly change: -6.79% | YTD change: 31.08%
Another important metric is Bitcoin dominance which can be used as a rough indicator of the relative strength of Bitcoin versus other cryptocurrencies.
A high Bitcoin dominance means that Bitcoin has a large market share and is potentially more influential in the overall cryptocurrency market and vice-versa.
Bitcoin dominance: Current Year: 41.37% | Last year (Feb 2022): 41.73%
Top crypto projects/protocols by different metrics
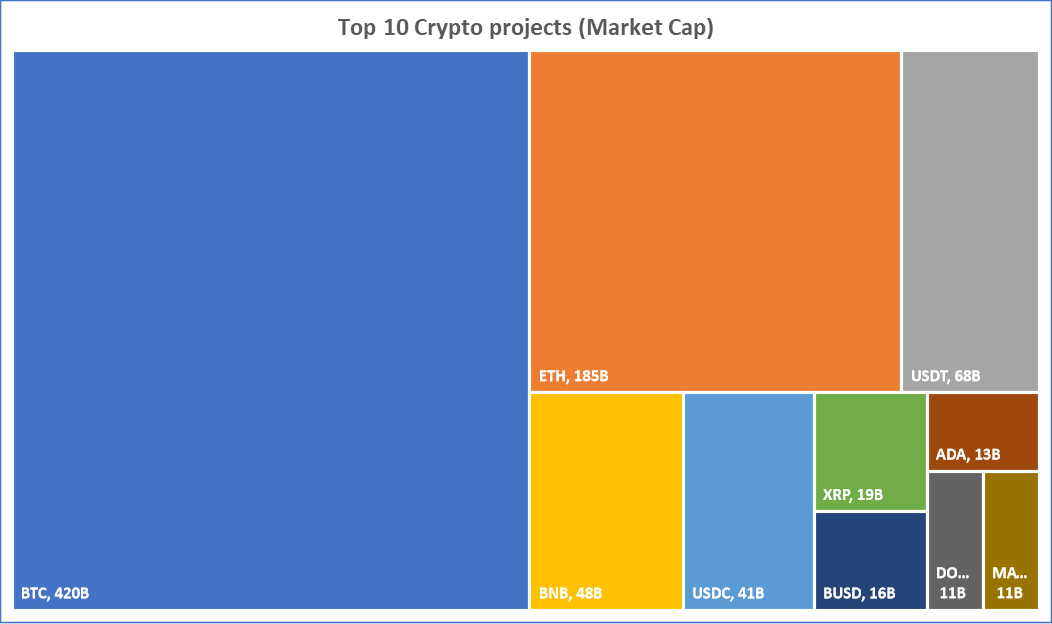
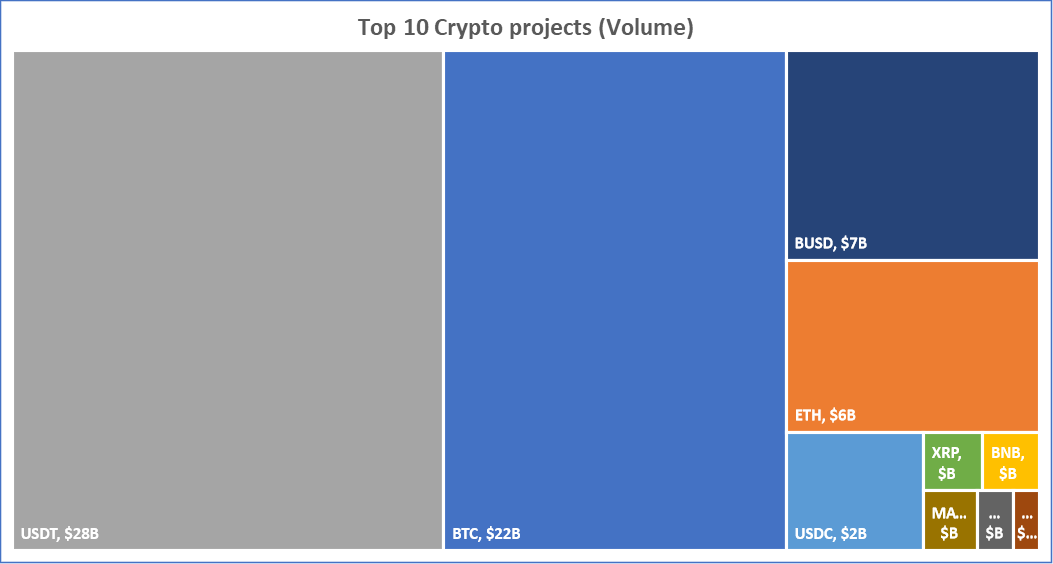
The Interesting thing to note here is that although Tether (USDT) has just $68B market cap, it is traded the highest with volume close to $28B given its use as a stablecoin for the exchange of assets. Meanwhile, Stablecoin market cap is at $138 Billion and has a 12.93% share of the total crypto market cap.
Greed and fear index
The market has cooled down a bit in in Feb as well, but the hopes of Bitcoin leading a rally to the moooooonnnnnn........ still remain
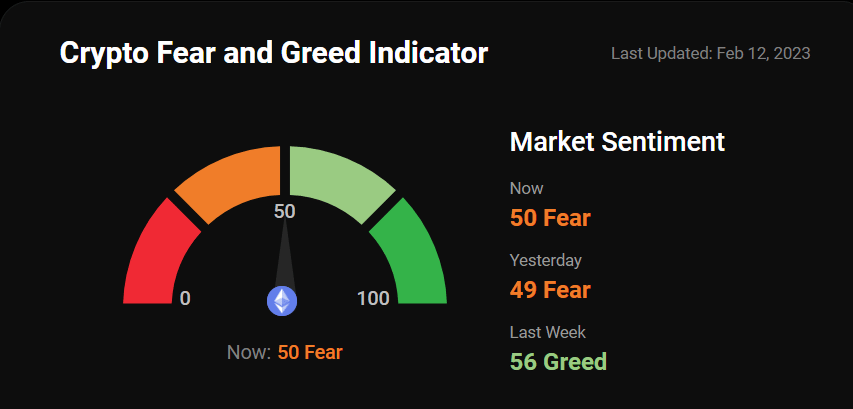
Note: The data used is based on metrics like Volatility, Surveys, Bitcoin Dominance, Social and Google Trends. Source: Coinstats
Is ETH ultrasound money?
Let's have a look at Ethereum supply changes post its merge to a PoS blockchain from PoW, as there is a shift in the narrative for Ethereum to become a store of value due to the expected reduction in ETH emissions. (Super Bullish)
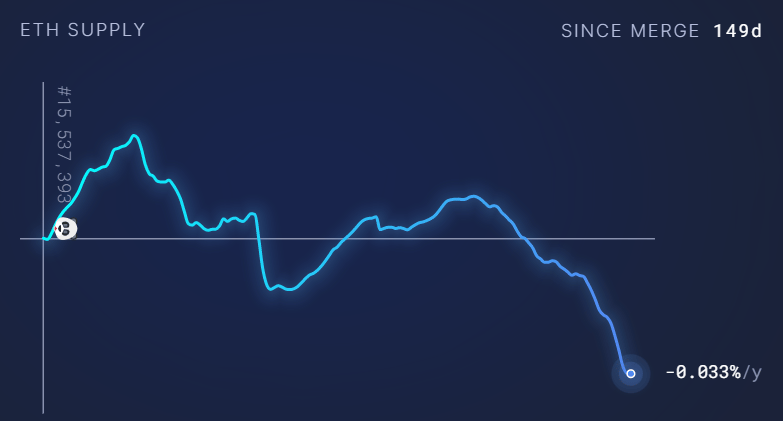
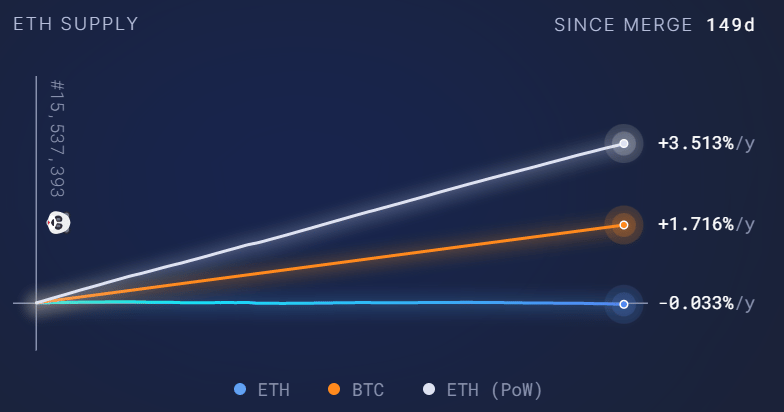
The graph highlights POS vs POW issuance since the merge. Impressive numbers, look super bullish for ETH long term given the supply of ETH is not growing as before
Supply change since merge POS -16,340 ETH
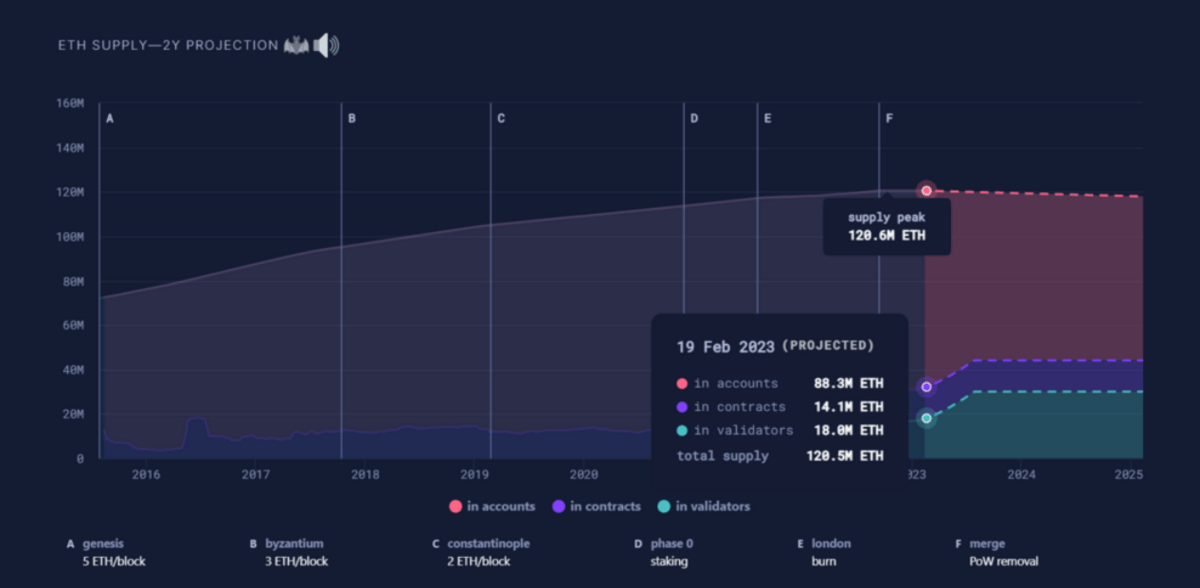
(Eth has officially less supply post merge, here is a look at the 2 year supply projections)
Spill the beans (Explain to me like a 5 year old)
A Guide to Cryptocurrency Fundamental Analysis (FA)
Cryptocurrency networks can't really be assessed through the same lens as traditional businesses. Why? Because these networks are different than traditional ones. In fact, the more decentralized offerings like Bitcoin (BTC) are closer to commodities. That is because of how decentralized it is - just like GOLD
In this newsletter, we can take a look at three categories of crypto FA metrics:
on-chain metrics
project metrics
financial metrics
ON-CHAIN METRICS

1. Transaction count
Transaction count is a good measure of activity taking place on a network. Also, we can see how activity changes over time by looking at the transaction counts for certain time periods.
However, we can't be sure that there isn't just one party transferring funds between their own wallets to inflate the on-chain activity. So it helps to look at this metric in conjunction with others
2. Transaction value
The transaction value tells us how much value has been transacted within a period. For instance, if a total of ten BTC transactions, worth $50 each, were sent on the same day, we would say that the daily transaction volume was $500. Similar to FIAT systems where it would be total money sent in Rupees or Dollars.
Interestingly, some network can be HIGH value networks and some could be LOW value based on how much volume is being moved.
3. Active addresses
Active addresses are the blockchain addresses that are active in a given period. Approaches to calculating this vary, but a popular method is to count both the sender and receivers of each transaction over time periods (e.g., days, weeks, or months).
Also, the number of unique addresses, daily address growth, monthly address growth give an idea of adoption and activity of a blockchain.
4. Fees paid
Fees paid or generated is part of the revenue model of any blockchain , the fees paid can tell us about the demand for block space.
We could think of them as bids at an auction: users compete with each other to have their transactions included in a timely manner. Those bidding higher will see their transactions confirmed sooner, while those bidding lower will need to wait longer.

5. Amount staked
Staking (in Proof of Stake, for example) is another related concept. The basic idea is that users stake their own holdings to participate in block validation. Why would they do it? Because the stakers are rewarded for participating and validating transactions
So, in a nutshell Ethereum and Bitcoin networks make money from the transaction fees generated apart from the monetary premium of holding it.
PROJECT METRICS:
1. The whitepaper
It is a technical document that gives us an overview of the cryptocurrency project. A good whitepaper should define the goals of the network, and ideally give us an insight into:
The technology used (for e.g Ethereum uses Solidity for development)
The use case(s) it aims to cater to (Lending, Borrowing or Staking service)
The roadmap for upgrades and new features
The supply and distribution scheme for coins or tokens (The tokenomics)
Also, it makes sense to understand the traction the project is gaining in terms of recent reviews by VCs or individuals in the space. The community behind the project and the developer ecosystem.
2. The team
Research into:
Have members undertaken successful ventures in this industry previously?
Is their expertise sufficient to reach their projected milestones?
Have they been involved in any questionable projects or scams?
If there is no team, what does the developer community look like?

3. Development Activity
This metric measures the level of activity within a project's development community. A high level of development activity can indicate a strong and committed development team, which is a positive sign for the project's long-term prospects.
4.Tokenomics and initial distribution
Tokens are an important part of GTM strategy for Crypto projects. But its important to understand whether the utility of token/project is something that the wider market will recognize, and how much it would likely value the utility at.
Another important factor to consider on this front is how the funds were initially distributed. Was it via an ICO or IEO and the whitepaper should outline how much is kept for the founders and team, and how much will be available to investors.
Distribution of tokens gives us an idea of any risk that exist. For instance, if the vast majority of the supply was owned by only a few parties, we might reach the conclusion that this is a risky investment, as those parties could eventually manipulate the market.
FINANCIAL METRICS
1. Market capitalization
Market capitalization (or network value) is calculated by multiplying the circulating supply with the current price. Essentially, it represents the hypothetical cost to buy every single available unit of the crypto asset.
By itself, market capitalization can be misleading sometimes. Nonetheless, market capitalization is used extensively to figure out the growth potential of networks. The so called "small-cap" coins could be more likely to grow compared to "large-cap" ones. On the other hand large-caps can have stronger network effects, and, therefore, stand a better chance than unestablished small-caps.
2. Liquidity and volume
Liquidity is a measure of how easily an asset can be bought or sold. A liquid asset is one that we'd have no problem selling at its trading price.
A problem we might encounter with an illiquid market is that we're unable to sell our assets at a "fair" price. This tells us there are no buyers willing to make the trade, leaving us with two options: lower the ask or wait for liquidity to increase.

Trading volume is an indicator that can help us determine liquidity. Typically, charts display the daily trading volume (denominated in native units or in dollars). Ultimately, it acts as an indicator of the market's interest in a project or blockchain network.
3. Supply mechanisms
Maximum supply, circulating supply, and rate of inflation can inform decisions. Some coins reduce the number of new units they produce over time, making them attractive to investors that believe the demand for new units will outstrip their availability.
This is how the mechanism of Bitcoin Halving works with the rewards to the miners halving every 4 years.
OTHER METRICS
New metrics come up/keep changing as investors try to find the right way to analyze crypto projects. Stock to Flow ratio of Bitcoin is one such metric, which is used to price commodities.
As its name suggests, the model assesses two attributes: stock and flow. Stock is the total existing supply of a commodity. Flow is the new supply of the commodity that is created each year. Comparing these two attributes helps you assess the commodity’s relative abundance in years.
The total supply of Bitcoin will be 21 million coins, of which nearly 19.2 million have already been mined.
Miners are currently rewarded with 6.25 BTC per block. With a block mined every 10 minutes, that translates to an annual flow of 328,500 BTC.
This means the current Bitcoin stock-to-flow ratio looks like this:
19,171,050 / 328,500 = 58.35 years (which means it will take 58.35 years to get to the current supply of BTC)
Incidentally, this is similar to the 62 years for gold.
What's brewing today? Bringing fresh beans to you:
Are the Remaining Crypto Giants Staring Down the Barrel of the US Government’s Gun? Insiders, experts and the rhetoric of officials suggest a reckoning with the government is inevitable for the big exchanges, and this week’s action against Kraken could be just the beginning.
Shopify launches suite of blockchain commerce tools for merchants: Shopify NFT merchants can now use the “tokengating” tools to dictate which tokenholders can and cannot gain access to exclusive products, NFT drops and benefits.
Friends With Benefits DAO Releases Social Networking App: The new application will allow FWB members to connect with each other, read governance proposals and discover in-person events.
Whats meme-ing?
And now the funny part,
What did you think of today's edition?
DISCLAIMER: None of this is financial advice. This newsletter is strictly educational and is not investment advice or a solicitation to buy or sell any assets or to make any financial decisions. Please be careful and do your own research.